แผนที่ออนไลน์ Longdo Map API version 3 (รุ่น Vector tile) นอกจากจะรองรับการทำงานที่หลากหลายแล้ว อาทิ ข้อมูล แสดงข้อมูล 3 มิติ, ขอบเขตการปกครอง, การสร้างหมุด (Marker) และอื่น ๆ อีกมากมาย แล้ว อีกการแสดงผลหนึ่งที่เป็นยอดนิยมก็คือ “Heatmap”
Heatmap คืออะไร ?
Heatmap หรือแผนที่ความร้อน คือการแสดงข้อมูลที่ใช้สีเพื่อแสดงระดับความเข้มข้นของข้อมูลในพื้นที่ต่างๆ ของภาพหรือแผนที่ ซึ่งเป็นวิธีที่มีประสิทธิภาพในการสื่อสารข้อมูลที่ซับซ้อนอย่างรวดเร็วและชัดเจน โดยทั่วไปแผนที่ความร้อนจะใช้สเปกตรัมของสีที่แตกต่างกันเพื่อแสดงระดับของค่าตัวแปรที่สนใจ ตัวอย่างเช่น สีที่อบอุ่นเช่นแดงหรือส้มอาจใช้แสดงค่าสูง ในขณะที่สีเย็นเช่นน้ำเงิน เป็นต้น
ตัวอย่างภาพ Heatmap แสดงข้อมูลอุบัติเหตุในกรุงเทพมหานคร
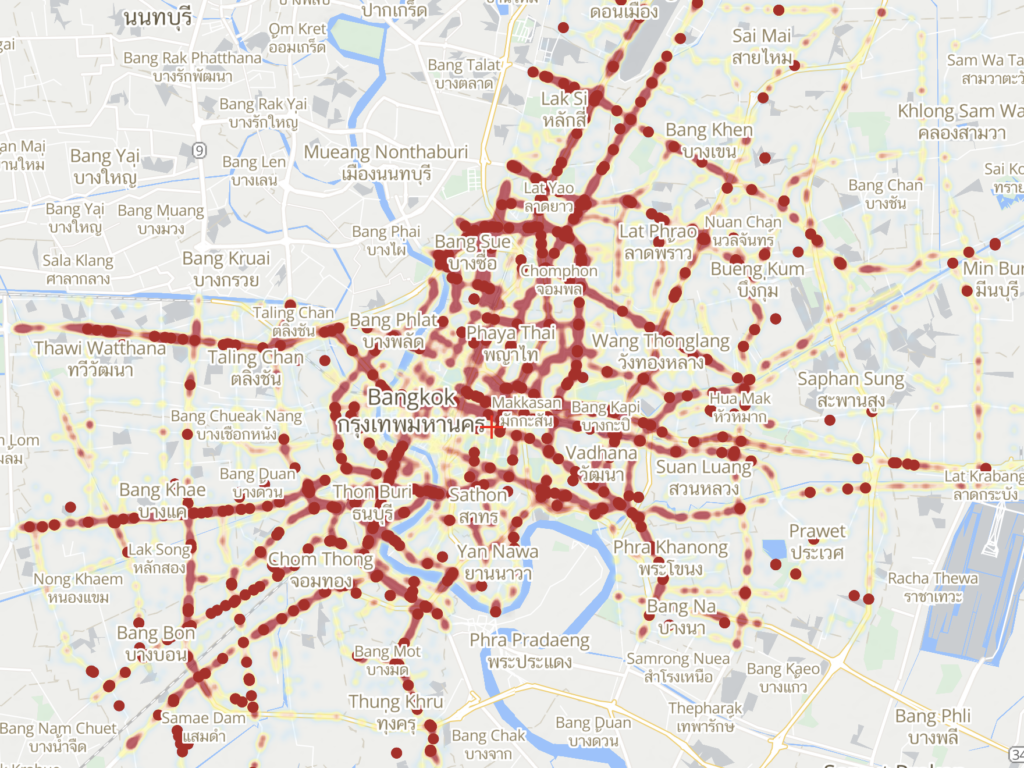
ตัวอย่างเว็บไซต์ การแสดงข้อมูลอุบัติเหตุ 100 จุดสูงสุด ในกรุงเทพมหานคร
วิธีการเรียกใช้
1. สร้างแผนที่พื้นฐาน ดูวิธีการเริ่มต้นใช้งาน
<script type="text/javascript" src="https://api.longdo.com/map3/?key=[YOUR-KEY-API]"></script>สมัครคีย์ได้ที่ https://map.longdo.com/console
2. สร้าง JavaScript function สำหรับสร้าง longdo.Map object ภายใน tag <head>
var map;
function init() {
  map = new longdo.Map({
    placeholder: document.getElementById('map')
  });
}
3. สร้าง div element สำหรับวางแผนที่ ภายใน tag <body> และใส่ onload ใน tag <body>
<body onload="init();">
    <div id="map"></div>
</body>
เมื่อได้แผนที่พื้นฐานแล้ว สิ่งถัดไปที่ต้องทำคือ การเรียกชั้นข้อมูล Heatmp
4. เรียกใช้ Heatmap และใส่ต้นทางข้อมูลที่เป็น geojson
<script>
var map
function init() {
map = new longdo.Map({
placeholder: document.getElementById('map')
});
map.Event.bind("ready", function () {
map.Layers.insert(1,
new longdo.Layer({
sources: {
earthquakes: {
type: "geojson",
data: "https://maplibre.org/maplibre-gl-js-docs/assets/earthquakes.geojson",
},
},
layers: [{
'id': 'earthquakes-heat',
'type': 'heatmap',
'source': 'earthquakes',
'maxzoom': 9,
'paint': {
// Increase the heatmap weight based on frequency and property magnitude
'heatmap-weight': [
'interpolate',
['linear'],
['get', 'mag'],
0,
0,
6,
1
],
// Increase the heatmap color weight weight by zoom level
// heatmap-intensity is a multiplier on top of heatmap-weight
'heatmap-intensity': [
'interpolate',
['linear'],
['zoom'],
0,
1,
9,
3
],
// Color ramp for heatmap. Domain is 0 (low) to 1 (high).
// Begin color ramp at 0-stop with a 0-transparancy color
// to create a blur-like effect.
'heatmap-color': [
'interpolate',
['linear'],
['heatmap-density'],
0,
'rgba(33,102,172,0)',
0.2,
'rgb(103,169,207)',
0.4,
'rgb(209,229,240)',
0.6,
'rgb(253,219,199)',
0.8,
'rgb(239,138,98)',
1,
'rgb(178,24,43)'
],
// Adjust the heatmap radius by zoom level
'heatmap-radius': [
'interpolate',
['linear'],
['zoom'],
0,
2,
9,
20
],
// Transition from heatmap to circle layer by zoom level
'heatmap-opacity': [
'interpolate',
['linear'],
['zoom'],
7,
1,
9,
0
]
}
},
{
'id': 'earthquakes-point',
'type': 'circle',
'source': 'earthquakes',
'minzoom': 7,
'paint': {
// Size circle radius by earthquake magnitude and zoom level
'circle-radius': [
'interpolate',
['linear'],
['zoom'],
7,
['interpolate', ['linear'],
['get', 'mag'], 1, 1, 6, 4
],
16,
['interpolate', ['linear'],
['get', 'mag'], 1, 5, 6, 50
]
],
// Color circle by earthquake magnitude
'circle-color': [
'interpolate',
['linear'],
['get', 'mag'],
1,
'rgba(33,102,172,0)',
2,
'rgb(103,169,207)',
3,
'rgb(209,229,240)',
4,
'rgb(253,219,199)',
5,
'rgb(239,138,98)',
6,
'rgb(178,24,43)'
],
'circle-stroke-color': 'white',
'circle-stroke-width': 1,
// Transition from heatmap to circle layer by zoom level
'circle-opacity': [
'interpolate',
['linear'],
['zoom'],
7,
0,
8,
1
]
}
},
],
})
);
})
}
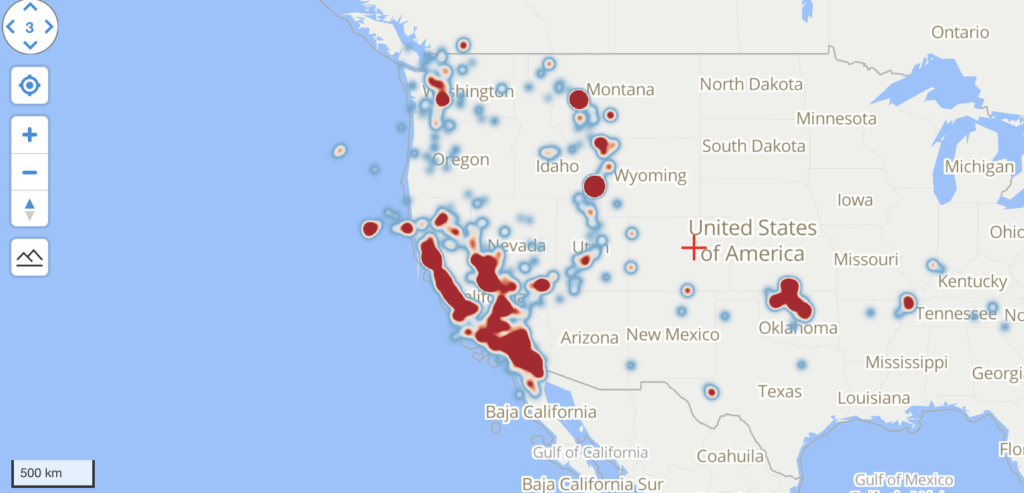
</script>ผลลัพธ์ที่ท่านได้คือข้อมูล Heatmap ของพิกัดแผ่นดินไหว
คู่มือพัฒนาระบบ https://map.longdo.com/docs3/javascript/marker/heatmap-marker